Useful Numbers
Some Boring Statistics
– boring maybe but very important to the policy makers.
There will be a lot of public attention on motorcycles in NSW soon with the upcoming protest ride about CTP and the current Staysafe Committee inquiry.
So here are a few stats to help you discuss the realities of riding your motorbike.
The traditional “temporary Australian” stories are about the road toll. This first graph and table shows the motorcycle road toll number for all states and territories in Australia from 1989 to 2009. No rolling averages or smoothing, just raw numbers.
Nothing surprising here. Even though there are more bikes on the road the numbers are reasonably stable because of:
- Better rider training,
- Some roads have been improved,
- Tyres and bikes have been improved,
- Riders talk about safety a lot more now compared to the late ‘80s thanks to the internet and rider groups.

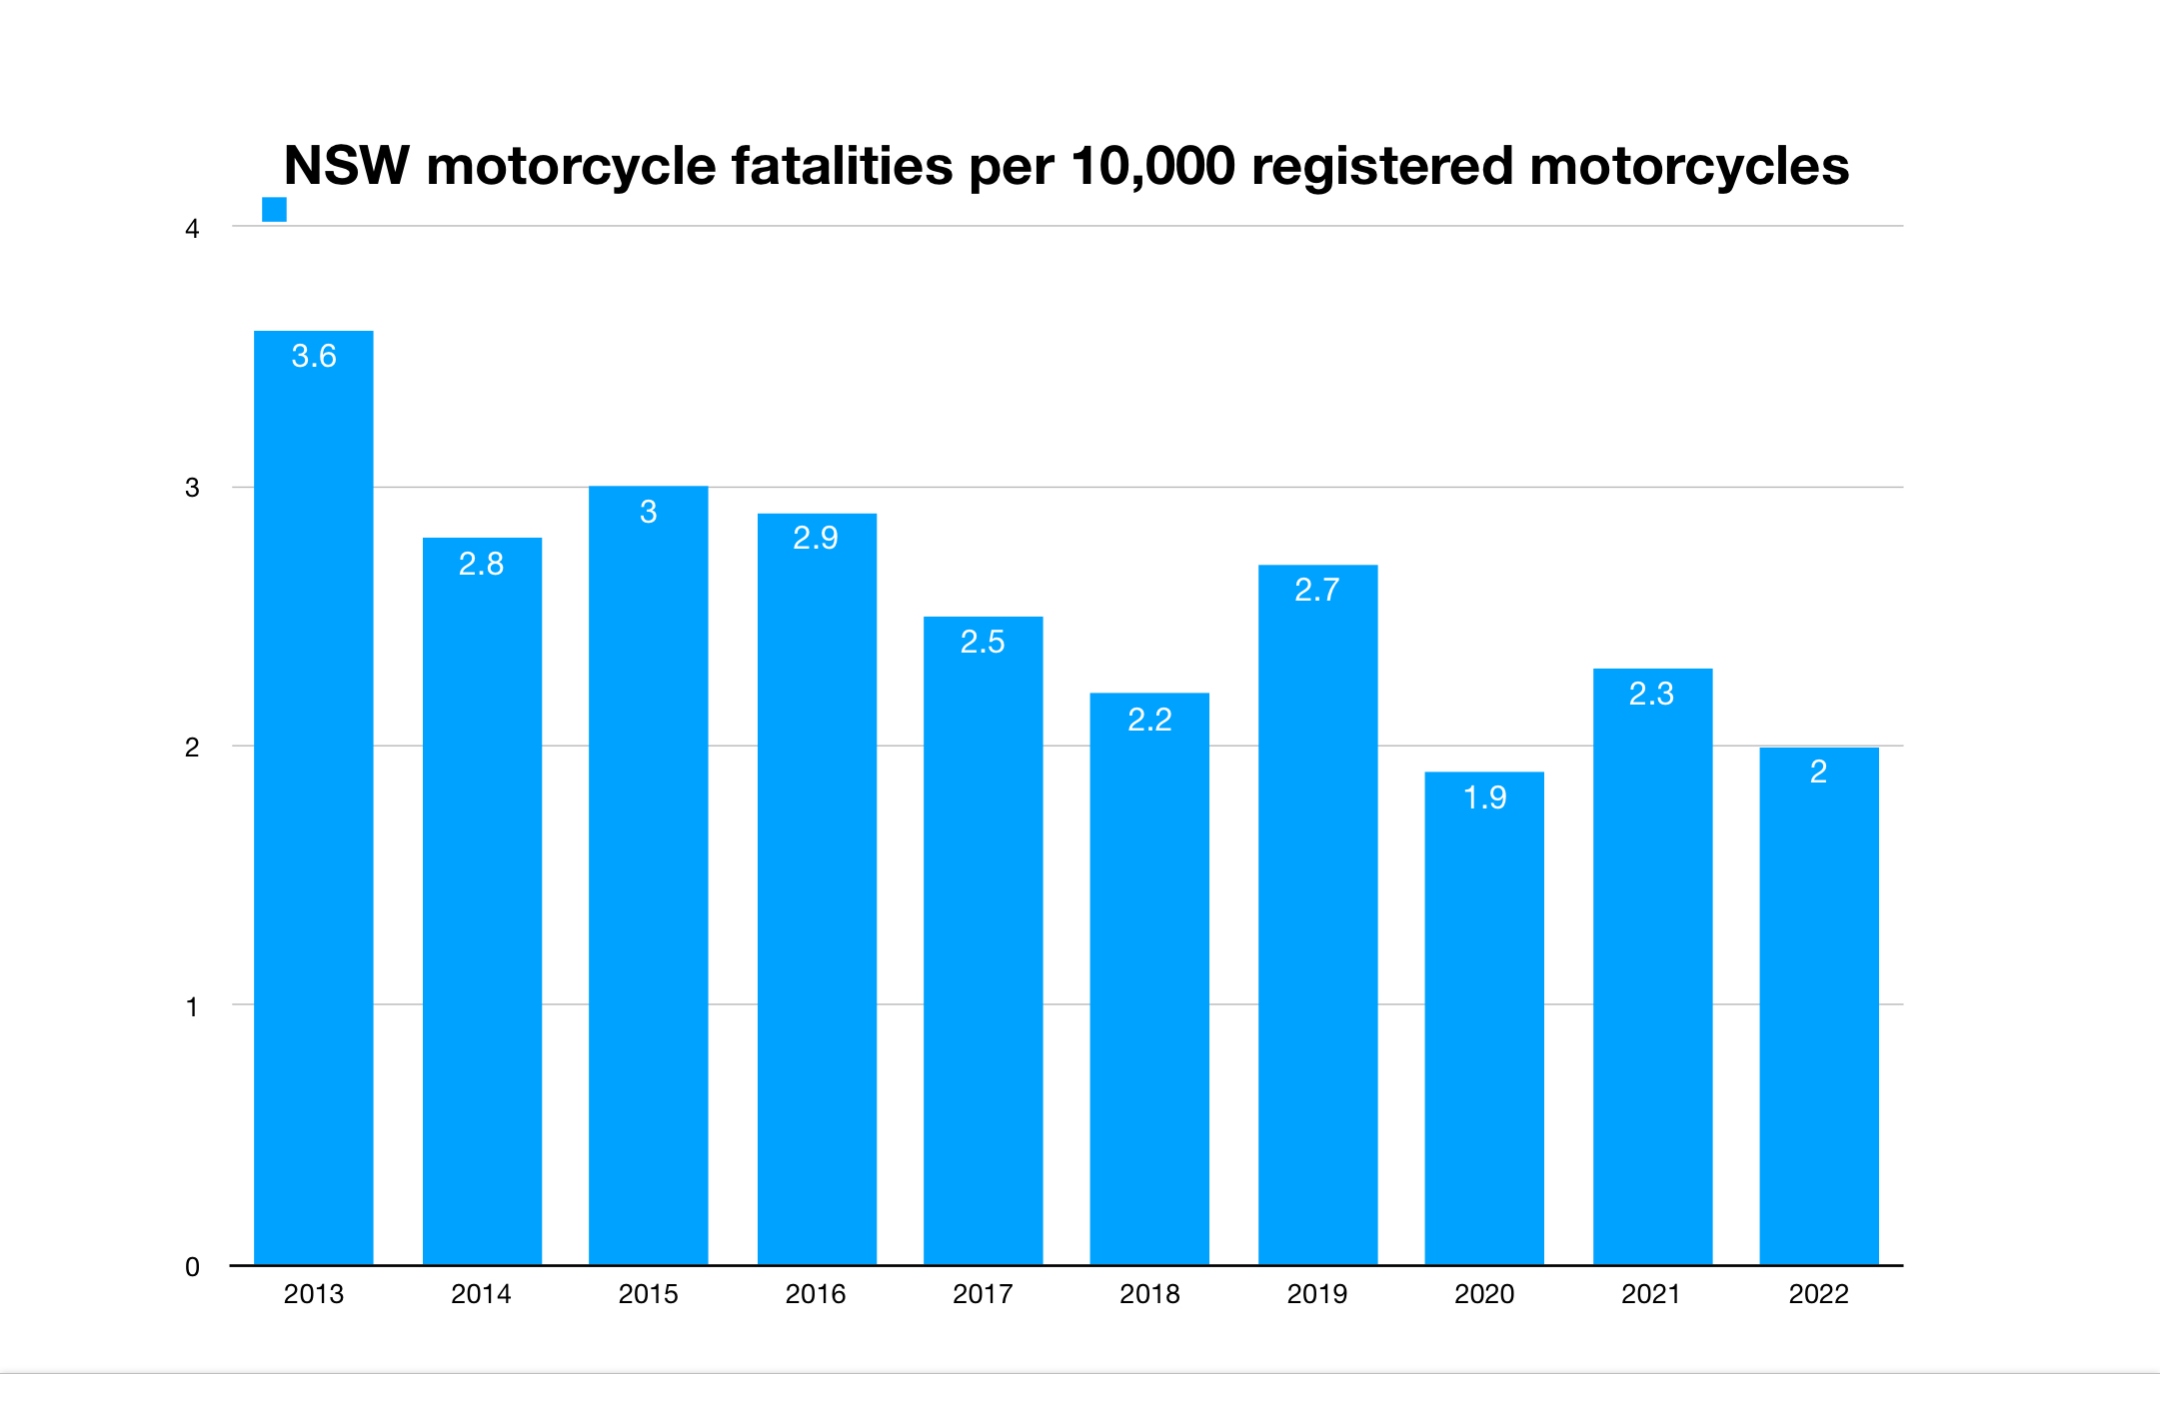
This next graph shows the NSW motorcycle road toll when indexed against the number of registered motorcycles in the state. As you can see, even though there are more of us on the road, since 2001 there are more riders doing the right thing and surviving the ride.
CONGRATULATIONS

All data used has been taken from official federal and state Government websites.